
TL;DR
- Omicron cases are projected to double every 2-3 days until a significant proportion of the population has become infected. This will result in a wave like nothing we have seen in Australia or oversease before.
- The peak in daily infections will be here sooner than you think, hit harder than you think, and be over faster than you think.
- During that peak, life will be very different. You do not want to get sick then.
- The risk right now is relatively low. Going shopping now may be 1000x safer than going shopping in 3 weeks. You may want to take some time to do minimal preparations now.
There is a very limited amount of maths in the first section of this post, but effort has been made to make this as simple as possible and accessible to anyone who can understand multiplication (and maybe square/cube roots). The conclusions should be accessible to everyone.
Omicron and Exponential Growth
The last few days have seen a disturbing number of health authorities around the world discussing how the new Omicron cases are doubling every 2-3 days. It’s straight forward to extrapolate exponential growth like this and show that a handful of cases can grow to be thousands very quickly, but for how long is such an extrapolation valid?
With any finite population, growth eventually slows due to an increasing proportion of the population that is naturally immune due to prior infection. We’ve seen previous waves in Victoria and NSW that have grown exponentially for a period before peaking in the thousands of cases per day. Are we likely to see the same thing here? Unfortunately, no. Other factors like lockdown measures, increasing vaccination rates and the changing of seasons have all had drastically more effect in the past than any reduction due to natural immunity previously, and the contagiousness of Omicron means that while measures like these may slow the spread, they won’t be enough to qualitatively change what is to come.
Why is Exponential Growth Wrong?
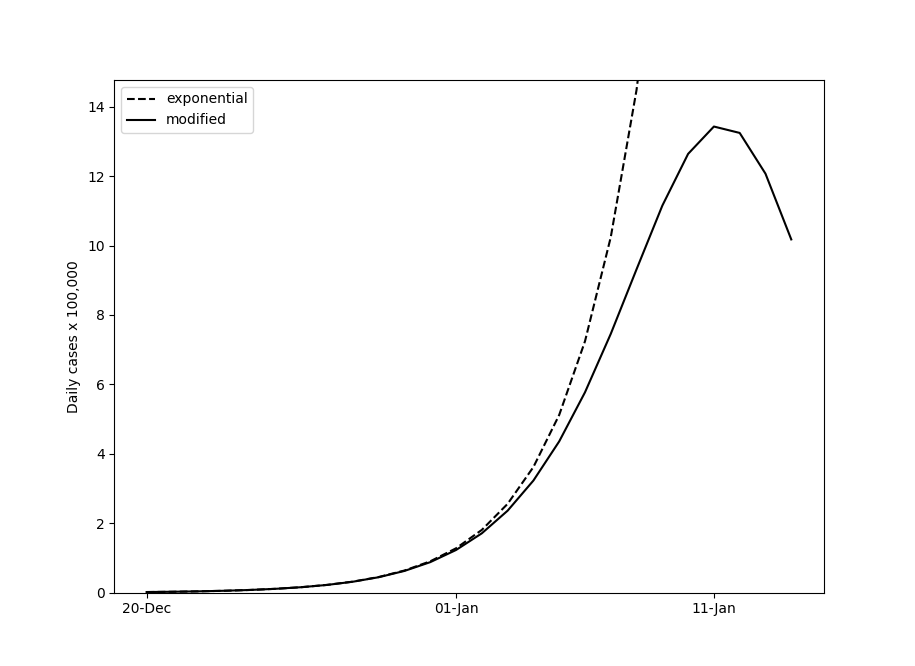
To understand why exponential growth cannot be extrapolated indefinitely, consider projecting data from NSW forward a month from December 20th. There were ~2000 Omicron cases, with a doubling period of about 2 days, or ~41% day-on-day growth. In 30 days, this model would predict almost 200 million total infections, 46 million of which occur on the final day. Clearly it’s not feasible that roughly twice the population of Australia would be infected in a single day.
A Better Model
The exponential model above can be characterised by the following equation:
tomorrow's cases = today's cases * daily factor.
That daily factor is the n-th root of 2, where n is the doubling period - or sqrt(2) = 1.41 for a doubling period of 2 days. A better model would adjust this daily factor depending on the proportion of the population that’s still susceptible to the disease. For example, if 10% of the population has natural immunity from previous infection, we would expect new cases to be 10% less than in a totally susceptible population.
daily factor = base daily factor * susceptible population / total population.
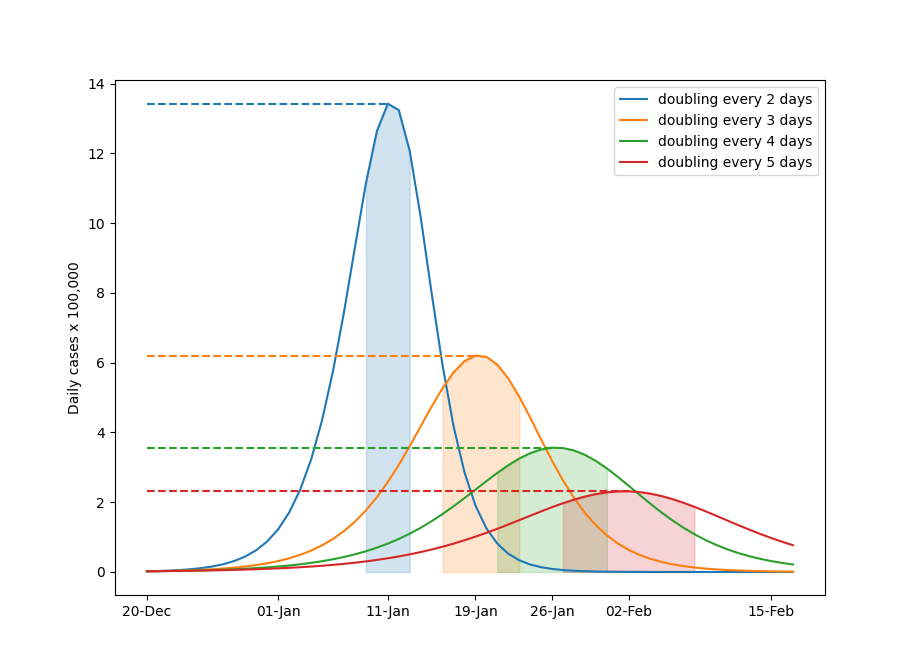
This base daily factor is the n-th root of 2 as above. If we re-run our model with this simple change, we see a departure from the ever-increasing exponential curve, and a wave similar in shape to those we’ve seen in the past. Critically different to previous waves is the scale however, peaking at over 1 million new infections daily. Note the difference between the curves only really becomes perceptible around new year’s day, by which point there are over 100,000 cases.
Disclaimer
Note there are definitely improvements that could be added to make this model more realistic. It would be much better to talk about base reproductive numbers, effective reproductive numbers as a result of social distancing measures and partial immunity from vaccination, incubation periods and infectious periods. It would be better to stratify the population based on age and use varying mobility data (a 25-year-old with kids interacts with the community differently to an 80-year-old in a nursing home). It would be better still to simulate millions of agents sampled from data distributions mined from census data, and average the result of multiple such simulations.
Each of these complexities adds potential accuracy, but also adds parameters that need to be computed from data - data which we largely don’t have at this stage. Perhaps more importantly, to explain it all would take much, much more space. I would end up with something akin to the Doherty report. Did you read the Doherty report? If so, congratulations - you’re not really my target audience, and you probably won’t get much out of reading this. If you didn’t read the Doherty report, then I’m guessing you wouldn’t have read a similarly complicated version of this post.
This model has been designed to be as simple as possible while still being qualitatively accurate. Quantities such as peak daily cases, total daily cases, and timing and duration of peaks should be considered ball-park estimates at best.
Vaccinations
Vaccinations combined with limited social restrictions have thus far held Australia’s delta wave in check. Unfortunately, for Omicron it seems vaccines give only limited protection from infectious disease. How much protection is an open question, but certainly depends on the time since vaccination and the type of vaccine used. Some estimates suggests AstraZeneca may offer 0% protection after 15 weeks, and while others are better it’s likely in the ~30% range. Boosters may go part-way to improving this, but the time-scale on which this wave is approaching and the current 5-month gap between second and third doses recommended by ATAGI means a significant proportion of the population will not have the opportunity to benefit from this. This partial protection will likely lower and flatten the curves somewhat, but by exactly how much is difficult to say without more data. I would be very surprised if it reduces things by more than a factor of 2.
That’s not to say vaccinations won’t make things significantly less dire. While they do little to protect from infection, there’s strong evidence that they dramatically reduce the hospitalisation and death rates - perhaps by a factor of 10.
Social Restrictions
Melbourne’s first wave was turned around by a strict lockdown. There doesn’t seem to be the political will to re-impose such measures here, and even if there were, the increased infectiousness of Omicron means they’d be unlikely to turn things around. Limited low-cost social restrictions like mask mandates and closing select venues like pubs and night clubs may increase the doubling period from 2 days to 3 to 5, but hoping for more than that may be overly optimistic. Re-running our simulations with these periods shows that longer doubling periods result in later, smaller, and flatter peaks. In these curves, 50% of infections occur in the shaded regions. While the smaller/flatter peaks would no doubt result in a significant number of lives saved as a result of better hospital access, all curves share the same qualitative features: a period of relatively low case numbers followed by a short, sharp peak.
4 Stages to the Wave
With that, I’d like to offer a qualitative forecast of the future. It will be wrong, but I’m curious to see just how wrong. Here’s hoping very wrong, but I’m a “hope for the best, plan for the worst” kind of guy. The following assumes modest restrictions like the reintroduction of mask mandates and possible short-term lockdowns around the peak. It does not account for a radical medium-to-long-term changes in state or national policy. The visualisation is based on a doubling period of 3 days, but as with everything in this post it is intended to qualitative appreciation. Specific dates and peak values should be considered ball-park estimates at best.
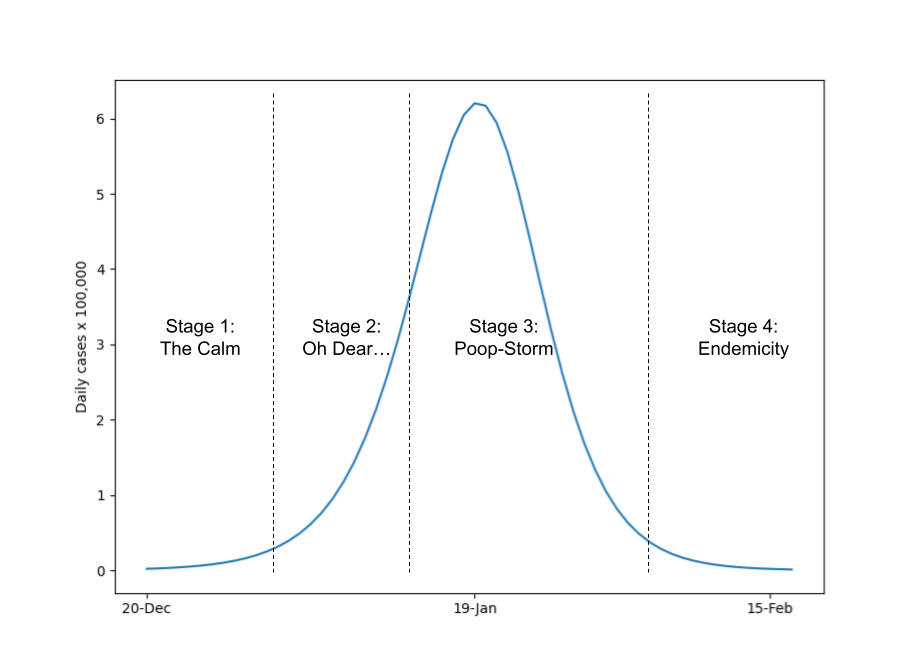
Stage 1: The Calm Before the Storm
This is the stage we’re in right now. Politicians are warning us to expect big numbers, but if our numbers above are remotely correct they’re not being entirely honest about quite -how- big. Nobody is panicing. Stores are fully stocked, hospitals are doing fine, businesses are open and people are out having fun in night clubs and cafes. While numbers climb from the hundreds into the thousands the risk to individuals is still relatively low. Those with a good appreciation of exponential growth are quietly preparing while they write articles like this to encourage their friends and community to do the same.
Stage 2: The “Oh Dear…” Moment
Realisation dawns. Case numbers start hitting the 10s of thousands, but unlike previous waves the curve doesn’t seem to be flattening. For many, it’s also the “I don’t have anything to whipe my poop” moment, as panic buying strips stores of essentials as people prepare for what they think will be months of lockdowns. Hospitals come under strain as surge capacity is activated and staff have to start making gut-wrenching decisions about who receives a ventillator - literally who lives and who dies. Most people have at least one friend who has become sick, and exposures become common. Testing systems are overwhelmed, and contact tracing becomes meaningless as a vast majority of people become primary or secondary contacts without any mechanism to be tested.
Politicians will try to calm things by pointing out seemingly low numbers in hospitals. This is false reassurance. Due to the typical 2-week lag between new cases and hospitalisations and the incredibly fast spread of the disease, the hospital system will be seeing the result of daily cases in the hundreds - very managable - even as we register 10s of thousands of new cases each day. The risk to you as an individual is no related to the number of cases in hospital - it is proportional to the number of cases in the community, and how many people will be in hospital when you might need it if you fall ill (typically 2 weeks in the future).
Stage 3: The Poop-Storm
The peak. It’s difficult to say exactly when it will hit, but my guess is late January. Whether it’s hundreds of thousands or a million cases a day doesn’t really matter, the sheer volume of people requiring medical attention combined with reduced capacity due to staff on sick leave will overwhelm hospitals. The hospital poop-storm will be behind the daily infections poop-storm, but before long people will be turned away from covid wards to die in their homes, and god help you if you need an ambulance or emergency care for any other reason.
There should be enough fresh food in stores to get by, but there will be limits on how much you can buy to try and combat panic buying. Staff shortages and supply chain issues will mean there won’t be the usual variety.
As for non-essential services, if the government doesn’t impose lockdown restrictions then you really don’t want to be out anyway. Dining in is a lot less attractive when there’s 100,000 new cases each day. As a result of poor patronage, most customer-facing businesses won’t be able to make enough to justify opening, let alone exposing their staff to the high risks involved (assuming they can find enough staff who aren’t sick as it is). Whether it’s government-enforced or not, most non-essential businesses will temporarily close.
If you need to go out for any reason, you’d best look like Lancelot. A significant proportion of the entire population will become infected in a 1-2 week window. If you’re at the shops, someone there will be presymptomatic. If you’re on public transport, you’ll be sharing air with someone who is presymptomatic. Not only is your chance of being infected greatest during this time, the consequences of complications - i.e. if you need medical treatment - are most severe. You will not be getting any medical treatment when you need it.
I don’t expect there to be riots or wide-spread disruption to utilities (electricity, water etc) or other essential services (except the hospital system as discussed above). I don’t believe shortages in stores will lead to people dying from starvation or because they can’t get their regular medication. I don’t believe there will be wide-spread rioting or looting, nor that the military will be deployed in some kind of martial law scenario.
Horrific as it is, this stage will be mercifully short. A majority of infections will occur in a week or two. After this, shortages in stores should be resolved relatively quickly. The lag between infection and hospitalisation and extended hospital stays will mean the health system will feel the effect for a number of months afterwards. The tail end will see a wave of medical resignations due to covid fatigue and work-related PTSD.
Stage 4: Endemicity
The wave has passed and most of the fuel has been burnt. Restrictions are lifted and the “new normal” sets in. Reinfection will occur as natural immunity wanes and new variants arise, though given most of the population will have some degree of natural immunity none should be as bad as this one. The “novel” coronavirus ceases to be novel. Without data it’s difficult to know at what level things will plateau at - perhaps thousands of cases a day, though this will likely be seasonal, much like the flu.
Key Takeaways
- Early 2022 is going to be bad. Spectacularly bad - even by 2020/21 standards. However, I don’t believe this is an existential threat to our way of life long-term. I think we are considerably better placed here in Australia than other areas of the world like Europe and North America. Our high vaccination rates mean per-incident hospitalisation rates and deaths will be low, and we are incredibly fortunate to be tackling this during the warmer months.
- A lot of people will get sick - possibly a majority of the population - but the chance of requiring medical attention for each individual will be low, particularly for those who have been vaccinated.
- Those unlucky enough to require medical attention during the peak - be it for covid or otherwise - will struggle to get it. The incredible people working in health care will do their best, but providing optimal patient treatment will be impossible. There will be truly traumatic experiences for people across the hospital system, patients and staff alike.
- For a pandemic that has been going on for two years, the peak will come and go incredibly fast. It may be weeks. It may be a month. It will not be years.
- It would be wise to be prepared to isolate as much as possible during the peak. Now is an appropriate time to make those preparations. Going shopping now may be literally 1000 times safer than going during the peak.
- You do not need 6 months worth of toilet paper. As a single male, I’ve got a spare 12 rolls. I’m planning on having enough frozen meals, canned food and long-life milk to last me a week. If everybody did that over the next few weeks there shouldn’t be any major shortages - and better now than during the poop-storm. I’ll be grabbing enough fresh food to last me another week once daily infections hit ~10,000 locally.
- Social contact is important for mental health. Be smart about when you decide to isolate. Giving up a week of social contact during the peak may provide as much protection as isolating for months either side. The risk right now is as low as it will be for quite some time.
- Personally, I’ll be seeing a few friends this week and catching public transport to visit family for Christmas lunch (I don’t have a car). After that I’ll be scaling back in-person social contact to a very small number of close friends, and minimising non-essential trips out.
- For the week or so of the peak I probably won’t leave my apartment, except maybe to walk to the park if I go stir-crazy. I recognize that my capacity to isolate is a privilege that not everybody has. That said, given that I can isolate, I am confident it is absolutely the right thing to do, both from a selfish personal-safety perspective and social responsibility.
- If you can get a vaccine booster, do. Do it now. Seriously, stop reading overly blog posts and either book an appointment or find a walk-in clinic. The internet will still be here when you get back.
Generate Your Own Plots
The code to generate the above images is available here. Feel free to play around with it or get localised predictions based on your area and case numbers.